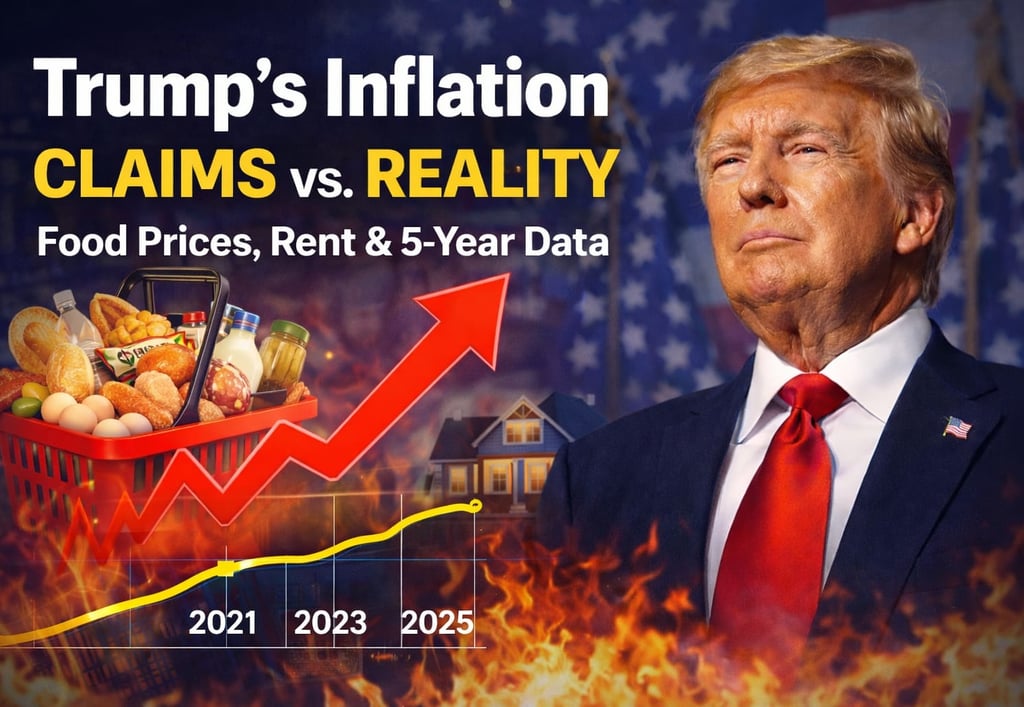
Trump’s Inflation Victory Claims vs Reality: Food Prices, Rent & 5-Year Data (2026)
Trump claims inflation victory, but food prices, rent, and energy costs remain high. A detailed analysis with five-year U.S. inflation data.
Raja Awais Ali
2/7/20263 min read
Trump’s Inflation Victory Claims vs Reality: Food Prices, Housing Costs, and Five-Year Inflation Data Explained (Feb 7, 2026)
Inflation has become one of the most defining economic and political issues in the United States, shaping public opinion, consumer confidence, and electoral narratives. In recent months, President Donald Trump has repeatedly claimed—nearly 20 times in economic speeches, rallies, and public remarks—that inflation in the U.S. has been defeated and that prices are finally under control. According to Trump, strong leadership, pro-business policies, and economic discipline have restored stability to the American economy.
However, when these claims are examined alongside official inflation data, five-year price trends, and the everyday experiences of American households, a far more complex and nuanced reality emerges.
Current Inflation Situation in Early 2026
As of late 2025 and early 2026, U.S. inflation has stabilized between 2.7% and 3% annually. While this represents a significant improvement compared to the inflation peak of 2022, it still remains above the Federal Reserve’s long-term target of 2%. Economists emphasize that slowing inflation does not mean prices are falling—it simply means prices are rising at a slower pace.
For consumers, this distinction is critical. Prices remain elevated across key sectors, particularly food, housing, and energy, which continue to strain household budgets despite improved headline inflation figures.
Five-Year U.S. Inflation Data (2021–2025)
A review of inflation over the past five years highlights why many Americans remain skeptical of victory claims:
2021: Inflation averaged around 7% as post-pandemic demand surged while supply chains struggled to recover.
2022: Inflation peaked at 9.1% in July, the highest level in nearly 40 years, driven by energy shocks, supply shortages, and global instability.
2023: Aggressive interest rate hikes by the Federal Reserve brought inflation down to approximately 4.9%.
2024: Inflation slowed further, fluctuating between 2.5% and 2.9%.
2025: Inflation remained relatively steady, averaging 2.7%– 3%.
These figures confirm that inflation has cooled significantly from crisis levels—but it has not disappeared.
Food Prices: The Real Inflation Pressure Point
Food costs remain one of the most visible and painful reminders of inflation for American families. Compared to 2021 levels, overall food prices in early 2026 are estimated to be 25%– 30% higher.
Key examples include:
Ground beef: Prices have increased by approximately 18%
Ground coffee: Up nearly 25%– 29%
Dairy products: Milk, cheese, and butter prices are 15%– 20% higher than five years ago
While egg prices declined by about 20%– 22% in 2025, this drop followed an unprecedented surge that had already pushed prices to historic highs. As a result, consumers experienced limited relief.
Housing and Rent: A Growing Burden
Housing costs have become one of the most persistent inflation challenges. Between 2021 and 2026, average U.S. rents increased by 20%– 25% nationwide. In major metropolitan areas such as New York, Los Angeles, and Chicago, rent increases in some neighborhoods exceeded 30%.
Although rent growth slowed in 2024 and 2025, prices remain historically high. Homeownership has also become less affordable due to elevated mortgage rates, making housing one of the largest contributors to ongoing inflation pressure.
Energy and Transportation Costs
Energy prices surged dramatically in 2022 following global supply disruptions and geopolitical tensions. While prices stabilized in 2024 and 2025, they remain significantly higher than pre-pandemic levels. On average, Americans are still paying 30%– 35% more for gasoline compared to 2020.
Electricity and utility bills have also remained elevated, further increasing the cost of living for households across income levels.
Wages vs Cost of Living
Although wages have increased in recent years, the growth has generally averaged 1%– 2% annually, lagging behind the rise in essential living costs. This imbalance has weakened purchasing power for many families, reinforcing the perception that economic conditions remain difficult despite improved inflation metrics.
Public surveys consistently show that a large portion of Americans feel financially worse off than they did before the inflation surge, particularly when it comes to groceries, rent, and utilities.
Key Causes Behind Persistent Inflation
Several factors continue to influence inflation pressures:
Post-pandemic demand recovery outpacing supply
Ongoing global energy and food price volatility
Labor shortages and rising wage costs
Supply chain inefficiencies
Corporate pricing power and profit-driven price increases (“greedflation”)
Trump’s Claims vs Economic Reality
President Trump is correct in stating that inflation has fallen sharply from its 2022 peak. However, declaring total victory overlooks the reality that prices remain elevated and consumer stress persists. Economists warn that inflation control should be measured not only by percentages but also by affordability and real household impact.
Conclusion
Inflation in the United States has undeniably improved compared to the crisis years, but the battle is not fully won. Five-year inflation data, food and housing prices, and wage trends all indicate that Americans are still navigating a high-cost environment. Trump’s repeated victory claims reflect a political narrative, while economic data paints a more restrained and realistic picture. The true test of inflation success lies not in speeches, but in whether households genuinely feel financial relief—and for many, that moment has yet to arrive.
Stay informed with the latest national and international news.
© 2026. All rights reserved.